
Microsoft Power BI UX Research
Usability research work on the
Microsoft Power BI's new feature
Note
This project is part of an NDA clause from the Microsoft stakeholders, and hence, most of the information is retracted in this case study. The purpose is to communicate a broad overview of the project and learnings.
Usability Study for testing a new Power BI feature:
How discoverable, findable, and readable is the content on the new view of the Metrics feature in Microsoft Power BI?
Overview
My Roles/Responsibilities
I served as the lead UX Researcher on this usability research project sponsored by Microsoft for their Power BI interface.
Context
Microsoft was looking to test a new feature in the Metrics view of their Power BI interface.
The problem that I tackled as a UX Researcher was whether the new view of the dashboard was discoverable, findable, and readable for users.
Impact
Based on the findings, I was able to address a user behavior gap and recommend 4 key design interventions.
This led to
Increased user engagement for creating and consuming scorecards by 10% since the
completion of the project and achieved a milestone of 500,000 MAUs.
Duration
3 months (01/01/2023) - (03/05/2023)
Stakeholders
1 UX Designer, 1 PM, and 1 Senior UX Researcher from the Microsoft Design Team
Method
Remote usability testing, behavioral interview questions (semi-structured), survey
Tools
Zoom, Google Workspace, Figma, Microsoft Excel, Microsoft Power BI
Domain Context
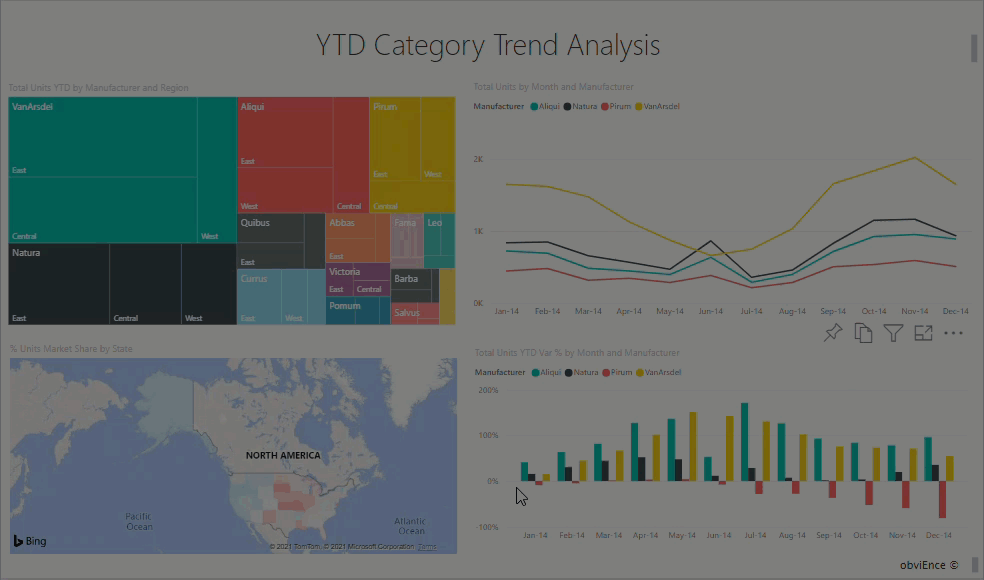
Dashboards representing data
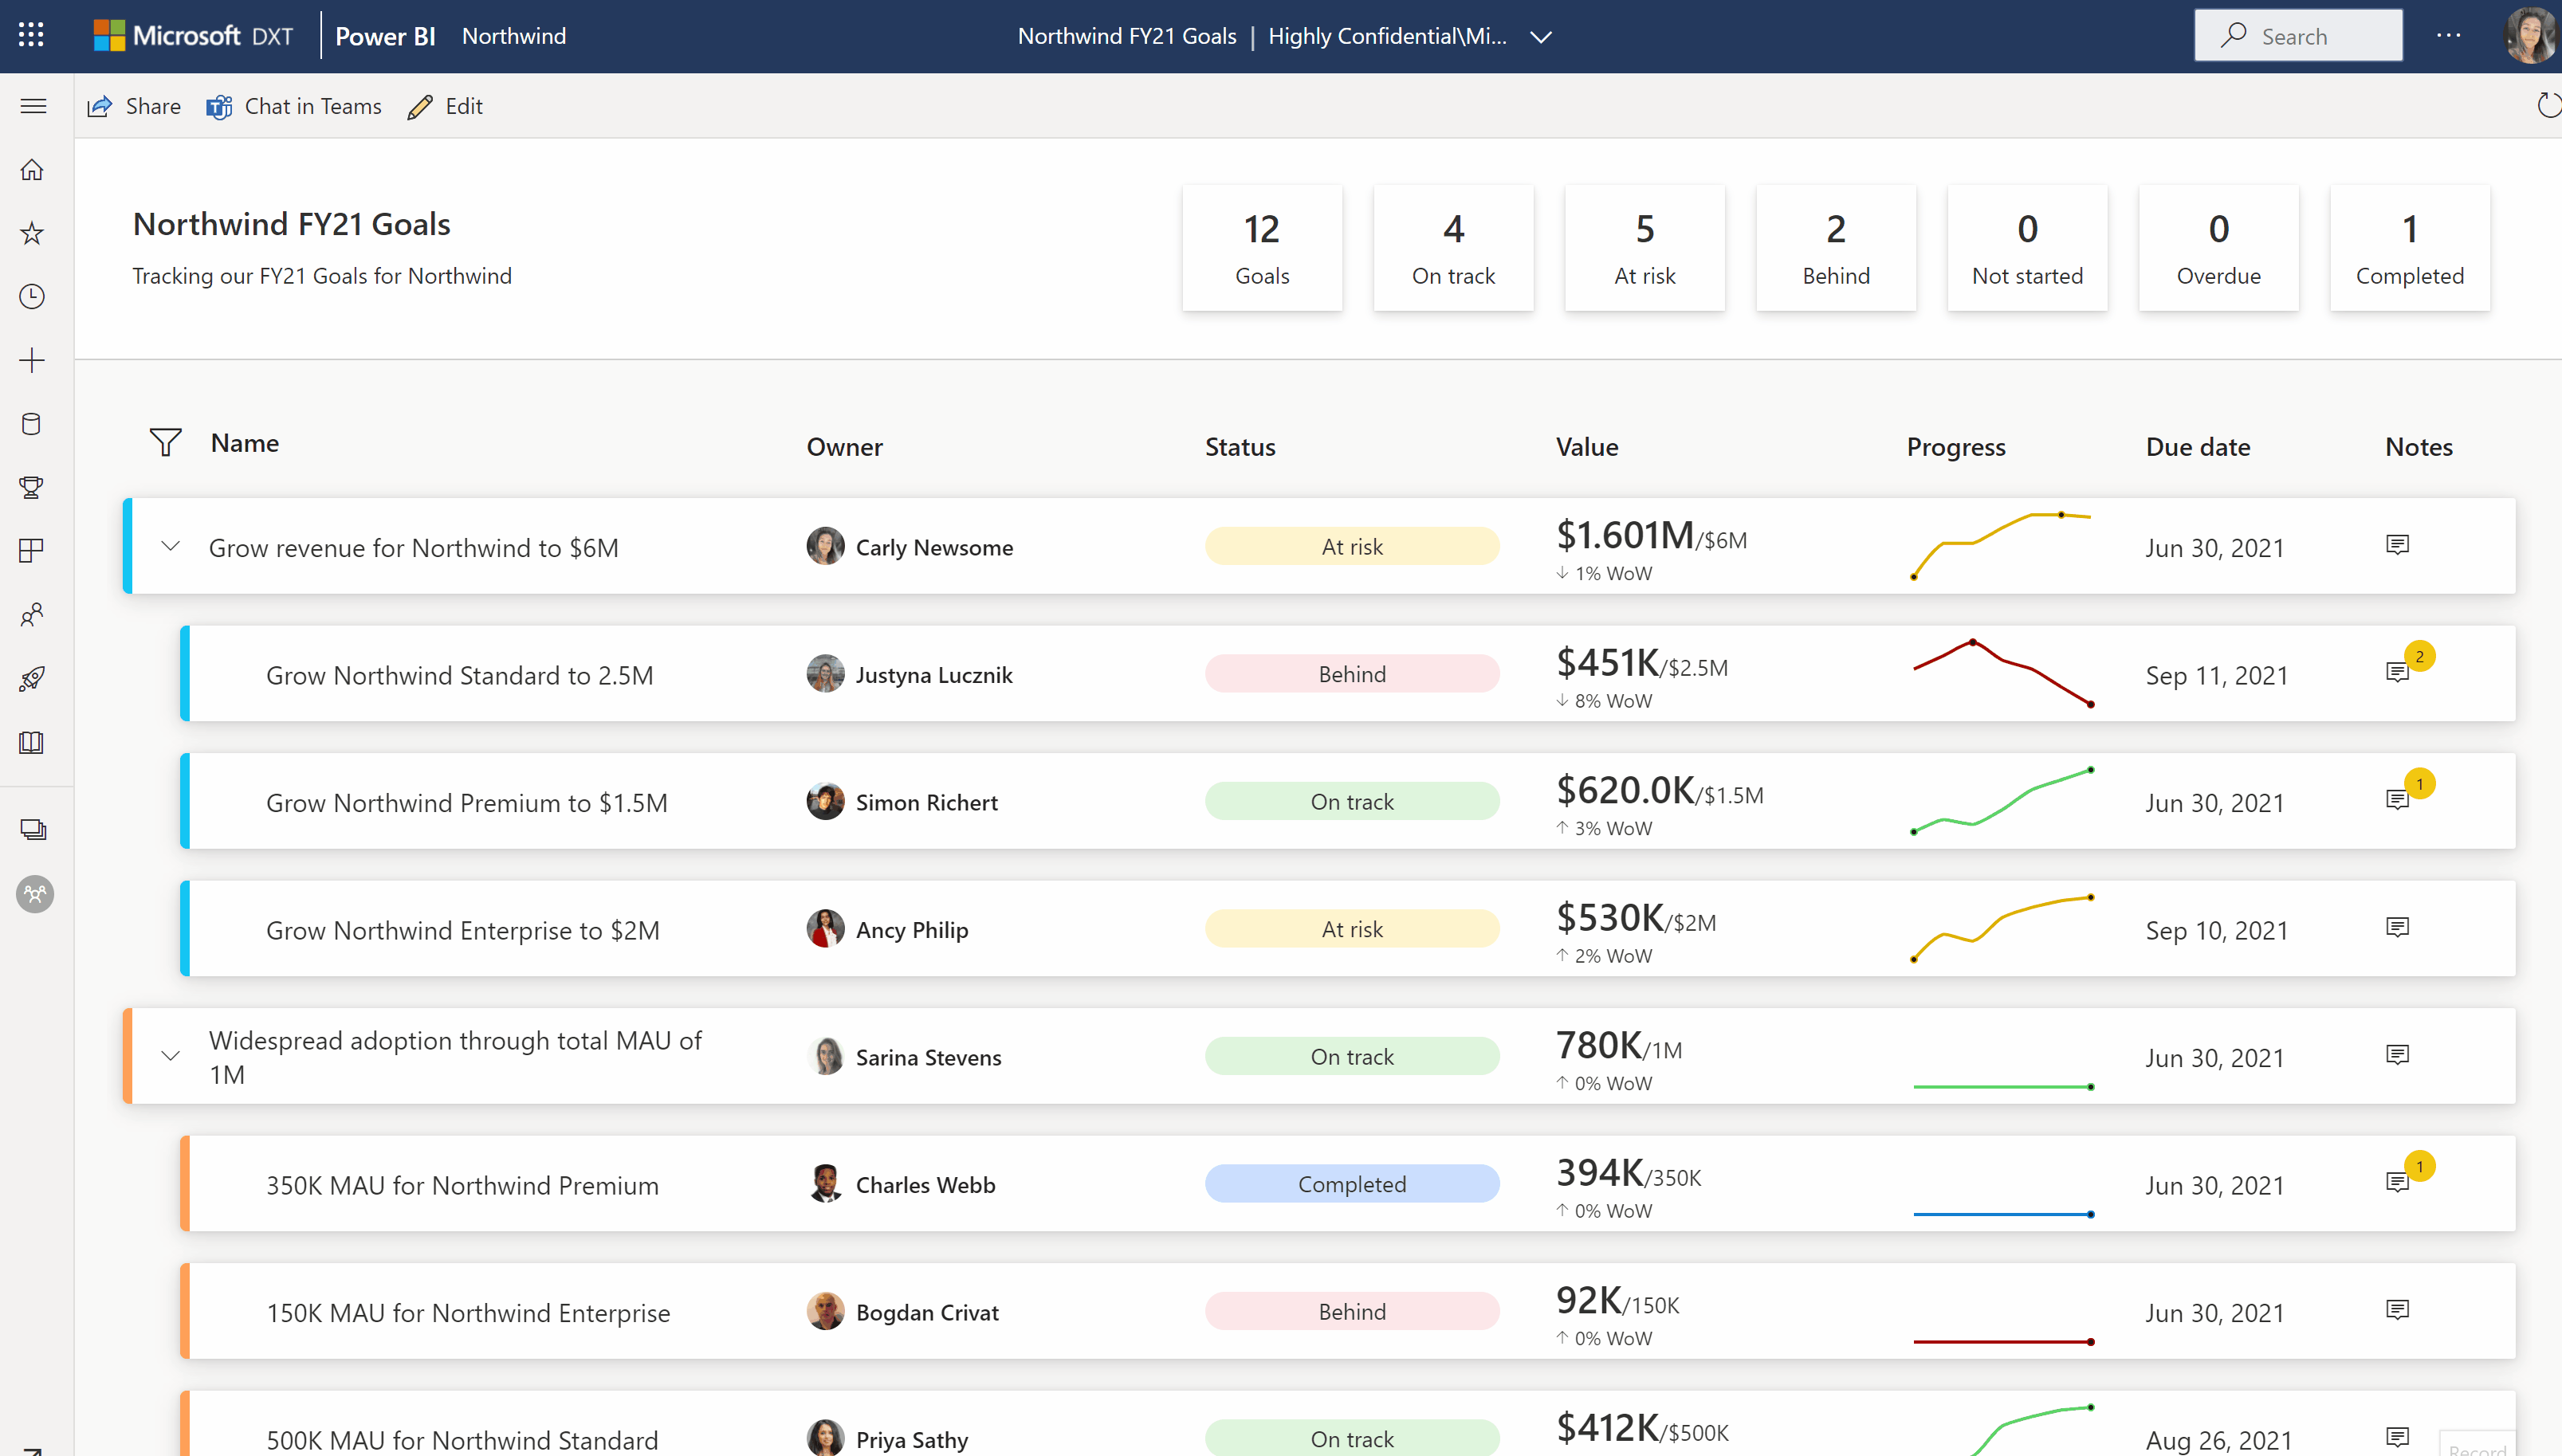
Analytical scorecards to track KPIs
Microsoft Power Bi is a business intelligence tool that helps users create interactive data visualizations, analysis, and presentations.
Microsoft works towards enabling users to gain actionable data-driven insights with the help of visualizations, tracking of key-performance indicators, and collaboration.
They wanted to test the usability of a new feature for key performance indicators which is what this project was about.
Research Questions
💠 Entry point: Do users understand that they have to enter the mode to customize the visibility and/or order of a setting?
💠 What are the users expectations for customization options?
💠 How findable/discoverable is the entry point for the new view?
💠 How likely are the users to understand that their changes in column settings in the new view, also reflect in the familiar view?
Research Methods
1. Brainstorming and Stakeholder Collaboration
Led the initial brainstorming sessions and discussions for project scoping and aligned with the stakeholders. Efficient communication and prioritization helped clear goal - setting and expectations.
2. Remote Usability Testing Sessions
Study Design
👩🏽💻8 Participants ⏳60 minutes Zoom

The employed technique was remote moderated usability testing sessions to answer the research questions. Since the product team was interested in knowing more about how users discover, find, and understand content on the new feature, I saw this method befitting.
This method enabled me to collect both qualitative and quantitative data on users interacting with the interface and dive deeper into their behaviors with follow-up questions.
It was explained and communicated with stakeholders that remote testing and usability and diving deeper into user behavior would be help answering the research questions efficiently.
Remote testing using Zoom was used to minimize cost and accommodate participants' schedules and locations.
Data Collection
Quantitative Data
-
Task Times : Objective time taken to complete task successfully
-
Task Ratings (Ease) : Subjective rating of ease by the participant for completing a particular task
-
Number of Tasks Completed Successfully : Objective account of sum of tasks completed successfully by the participant
-
Number of Clicks : Objective measure of clicks taken to complete the task successfully / fail
-
Task Success / Failure : Objective measure of pass / fail for a particular task
-
Post-Test SUS Questionnaire : Quantitative measure of subjective perceived usability of the feature
Qualititative Data
-
Pre - Test Questionnaire : Helpful in noticing certain mental models that existed with participants due to their prior experience with certain tools
-
Thinking Aloud Technique : Crucial to understand the discoverability of the new feature
-
Post - Task Open Ended Questions : Crucial to understand user behavior contextually
-
Post - Test Open Ended Questions : Understanding the overall sentiment and issues faced by users
Analysis
The Figma tool, FigJam, was used for affinity mapping analysis of the qualitative data of each participant. Comments and answers with common themes were clustered together and usability problems were identified.
The pre-test questionnaire answers regarding participant backgrounds were helpful in noticing certain mental models that existed with participants due to their prior experience with certain tools.
The quantitive data was analyzed with Excel and it helped in triangulation of the measures to determine findings.

Affinity Mapping
Findings
Finding 1
Users had difficulty finding an essential button.
Severity Rating: 3 (Minor) as it impacted several users causing minor levels of frustrations and increasing time to complete the task
Finding 2
Essential mode was not discoverable.
Severity ranking: 1 (Critical) as it prevents users to enter the essential mode in order to edit necessary information.
Finding 3
Users had difficulty locating an essential settings.
Severity ranking: 2 (Major) as it prevents users from editing necessary information.
Finding 4
Users are likely to understand that their changes would be reflected across different views.
Severity ranking: 4 (Suggestion) as it a possible enhancement.
Impact
Findings led to design changes and increased user engagement for creating and consuming scorecards by 10% since the completion of the project.
Reflections
The project was successful due to the efficient collaboration between our team members and the Microsoft stakeholders. Honest communication, well-defined goals, and timelines were also essential in making this experience a holistic one. Personally, I was exposed to a formal work-setting project with stakeholder expectations, plans, and timelines. I learned a lot in terms of industry timelines, realistic targets, communication with stakeholders, and presentations of findings.
If I could have done anything differently if timeline and resources would have aligned would have been to employ randomization for participant recruitment instead of snowballing to avoid bias.